
Stock status guide
A guide to understanding the columns shown on the Stocks Status screen.
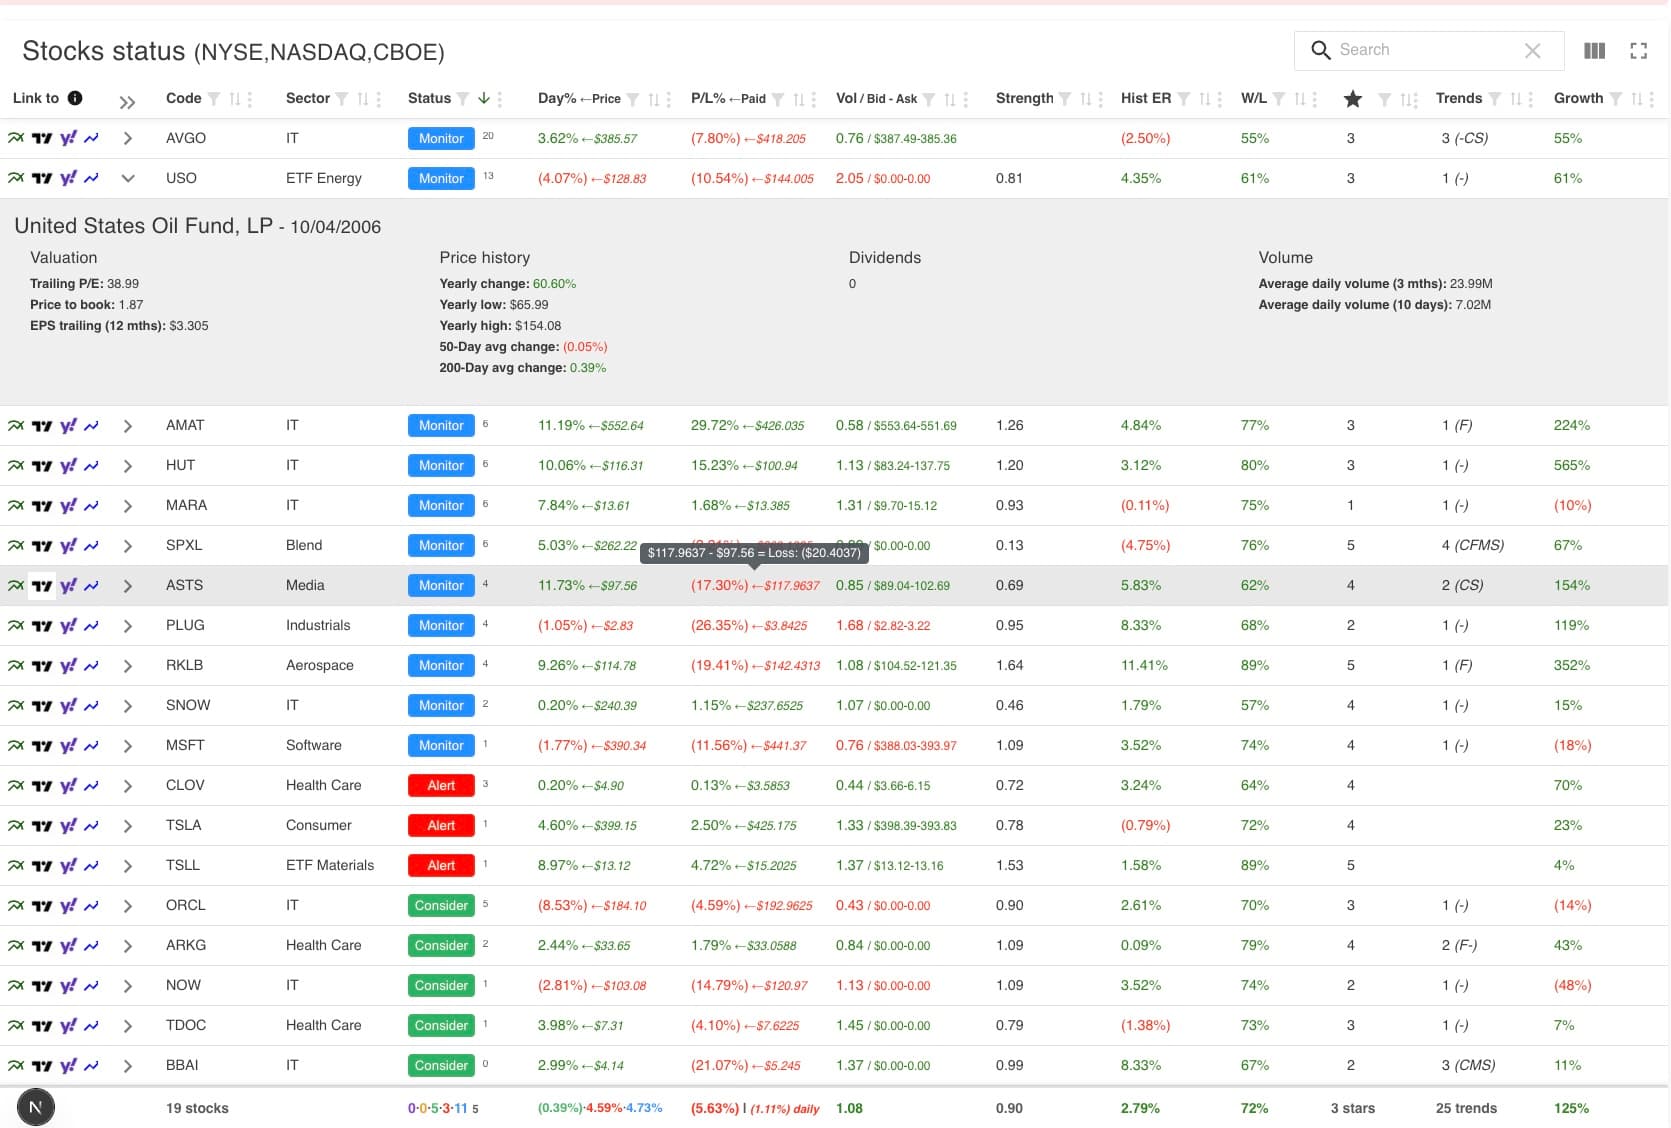
Column reference
Status
A three-stage indicator tracking a stock's progress through a cycle. Watch means monitor for activity. Consider signals a potential buy opportunity. Alert suggests offloading the position. Monitor means hold after a Consider signal has been acted on.
Day% — Price
The stock's current price alongside the percentage it has risen or fallen for the day. Refreshed every minute.
P&L% — Paid
The percentage gain or loss since the suggestion status was first raised, alongside the price at the time the status was triggered.
Vol / Bid / Ask
Current trade volume relative to average volume, together with the live bid and ask prices.
Strength
A composite performance score based on risk and return using the Kelly Ratio, benchmarked against the average stock on the platform.
Hist ER
Historical Expected Return — the average return earned per stock suggestion over the measured period, based on historical model performance.
W/L
Win/Loss % — the probability of a stock rising versus falling, expressed as a win/loss ratio based on past suggestion outcomes.
Stars
A rating reflecting the number of favourable technical and fundamental indicators currently active for that stock.
Trends
A summary of the different trend types currently active, helping investors quickly assess momentum and direction.
Growth
The stock's 52-week price growth, providing a clear picture of longer-term price momentum.
Profit / Loss
The total projected profit or loss on a standardised $1,000 investment across all suggestions over the period, reflecting the cumulative outcome of all winning and losing trades.
Stock performance guide
Each stock is accompanied by a comprehensive set of backtested performance and risk metrics, giving investors a data-driven foundation for every decision.
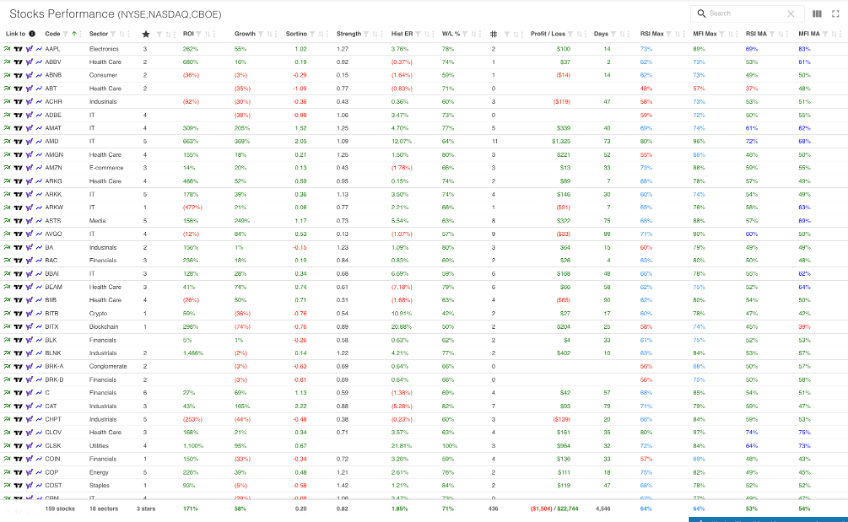
Column reference
ROI
Backtested Return on Investment over a defined period, typically one year. Shows how the stock has historically performed under the platform's model.
Growth
The stock's 52-week price growth, providing a clear picture of longer-term price momentum.
Sortino Ratio
A risk-adjusted return metric similar to the Sharpe ratio, but focused specifically on downside volatility — rewarding stocks that deliver returns without excessive downside risk.
Strength
A composite performance score based on risk and return using the Kelly Ratio, benchmarked against the average stock on the platform.
Hist ER
Historical Expected Return — the average return earned per stock suggestion over the measured period, based on historical model performance.
W/L %
Win/Loss % — the probability of a stock rising versus falling, expressed as a win/loss ratio based on past suggestion outcomes.
# (Suggestion count)
The number of times the model has flagged this stock as a suggestion over the defined period.
Profit / Loss
The total projected profit or loss on a standardised $1,000 investment across all suggestions over the period, reflecting the cumulative outcome of all winning and losing trades.
Days
The average number of days the stock was held per suggestion.
Market status guide
A guide to understanding market status codes, rating scores, and trend signals. Each exchange is assessed independently across two timeframes. The short-term status reflects current momentum and recent price action. The long-term status looks at broader trend conditions and provides a wider view of where the market may be heading over a longer horizon.
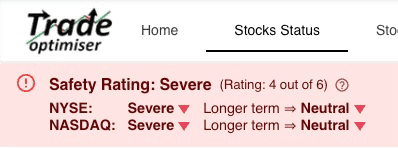
Status
Rating
What it means
Neutral
Healthy conditions0
out of 6
No bearish signals are present. Market conditions are healthy and no action is required. This is the default state.
Minor
Mild weakness1
out of 6
One warning signal has appeared. Conditions are not yet alarming but warrant monitoring. Further deterioration could move the market into Elevated.
Elevated
Increasing risk2
out of 6
Two signals are active. Risk is meaningfully above baseline. Short-term and long-term conditions may be diverging and a pullback is possible.
Caution
Multiple warnings3
out of 6
Three signals are active simultaneously. A meaningful pullback or trend weakness is likely. Broad market deterioration is beginning to show across multiple measures.
Severe
Significant risk4
out of 6
Four signals are active. Broad market deterioration is underway across multiple measures of price trend and momentum. Defensive positioning is warranted.
Catastrophic
Maximum alert5–6
out of 6
Five or six warning signals are active at once. This is an extreme, high-confidence bearish reading. Market conditions are severely stressed. This state is rare and requires urgent attention.
Up
Price is expanding with bullish momentum. The market is not in a squeeze and moving averages confirm an upward direction.
Down
Declining momentum is confirmed. Either a bearish price pattern has formed or moving averages have turned downward.
Compression
The market is in a volatility squeeze. Direction is indeterminate — neither up nor down is confirmed until the squeeze releases with a breakout.
Stock indices guide
A guide to understanding the columns shown on the Indices Data screen, covering market health, price movements, and trading volume across major exchanges.
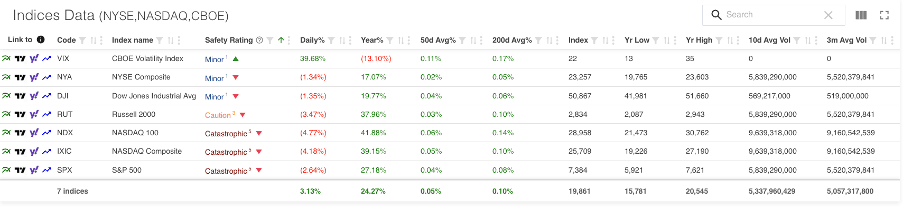
Column reference
Link to
Quick access links to external resources for that index, such as charting tools or market data pages.
Code
The ticker symbol identifying the index (e.g. VIX, NYA, DJI).
Index name
The full name of the index (e.g. Dow Jones Industrial Average, S&P 500).
Safety Rating
A risk classification for the index's current condition, giving investors an at-a-glance health check of the broader market.
Daily %
The percentage the index has moved up or down for the current trading day.
Year %
The percentage gain or loss for the index over the current calendar year.
50d Avg %
The percentage change relative to the 50-day moving average, indicating short-term trend direction.
200d Avg %
The percentage change relative to the 200-day moving average, indicating longer-term trend direction.
Index
The current numerical value of the index.
Yr Low
The lowest value the index has reached over the past 52 weeks.
Yr High
The highest value the index has reached over the past 52 weeks.
10d Avg Vol
The average daily trading volume over the past 10 days, indicating recent market participation levels.
3m Avg Vol
The average daily trading volume over the past three months, providing a longer-term baseline for trading activity.
Custom chart guide
Selectable from each stock and sector. Custom charts include price, trends, flags, and Bollinger Bands, alongside a choice of technical indicators. You can also open any stock directly in TradingView for a full-featured charting experience.
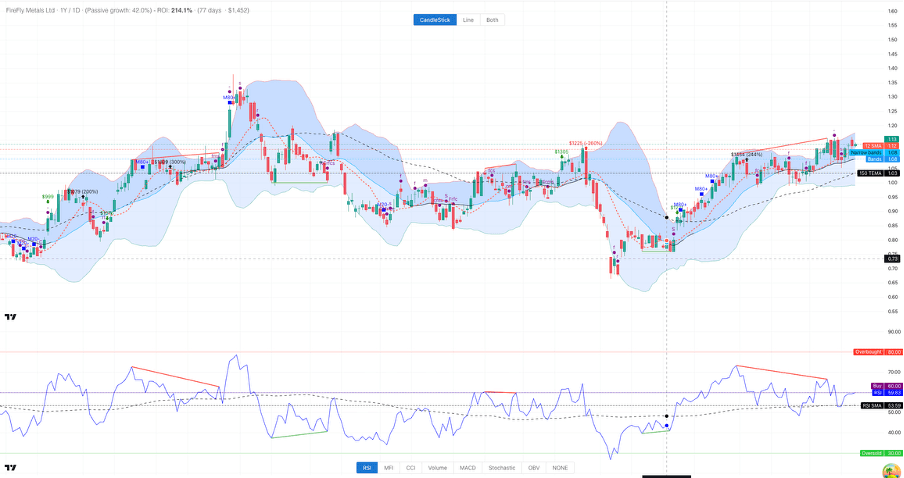
Chart features
Candlestick / Line / Both
Toggle between candlestick, line, or a combined view of both. Candlestick charts show the open, high, low, and close for each period. Line charts plot the closing price and are useful for a cleaner view of overall trend direction.
Price & trend flags
Buy and sell suggestion flags are overlaid directly on the price chart at the point each signal was triggered, making it easy to review historical model decisions in context.
Bollinger Bands
A volatility envelope plotted around the price, consisting of an upper band, lower band, and a central moving average. When the bands widen the market is volatile; when they narrow the market is compressing, often preceding a breakout.
TEMA (Triple Exponential Moving Average)
A fast-reacting moving average that reduces lag compared to standard EMAs. Useful for identifying trend direction and potential entry and exit points.
Technical indicators
RSI
Relative Strength Index — a momentum oscillator measuring the speed and magnitude of recent price changes. Readings above 70 indicate overbought conditions; below 30 suggest oversold conditions.
MFI
Money Flow Index — a volume-weighted RSI that incorporates both price and volume to measure buying and selling pressure. Values above 80 are considered overbought; below 20 oversold.
CCI
Commodity Channel Index — measures a stock's deviation from its average price. Positive values indicate the price is above the historical average; negative values indicate below. Extremes can signal potential reversals.
Volume
The number of shares traded during the period. Spikes in volume often confirm the strength of a price move — rising prices on high volume are more significant than the same move on low volume.
MACD
Moving Average Convergence Divergence — tracks the relationship between two exponential moving averages. Crossovers of the MACD line and signal line are used to identify potential trend changes and momentum shifts.
Stochastic
A momentum indicator comparing a stock's closing price to its price range over a set period. Readings above 80 suggest overbought conditions; below 20 suggest oversold conditions.
OBV
On-Balance Volume — a cumulative volume indicator that adds volume on up days and subtracts it on down days. Rising OBV confirms an uptrend; falling OBV confirms a downtrend. Divergence from price can signal a coming reversal.